

Who’s Eating NZ Hospitality’s Margin? Prices vs Wages vs Inputs, 2019–2025

Since 2019, the average Kiwi bill went up by about a third. Wages did too. Ingredients, power, and rent rose—just not as fast. So why do so many operators still feel skint? Because averages hide the realities of format, lease, and labour design. Here’s the data, the nuance, and the Monday-morning moves.
The main brief
Menu prices (CPI “restaurant meals & ready-to-eat”): ~+33% from late-2019 to mid-2025, with 8–12% annual bursts in 2022–23 as costs spiked.
Hospitality wages (Accommodation & Food Services): from ~$22–23/h in late-2019 to ~$29.7/h in 2025 Q2 (~+30%).
Food input costs (PPI Inputs): ~+21% since 2019; surged in 2022, then cooled.
Energy (electricity/gas): ~+15% net increase, highly volatile
Rent proxy (CPI rents): ~+20% step-up over the period; commercial leases may differ
On the national averages, menu prices kept pace with wages and outpaced non-labour inputs. That means a small margin tailwind vs the 2022–23 chaos. If you’re not feeling it, the culprit is usually labour design and lease structure, not ingredients.(Figure.NZ , summary of Stats NZ QES)
The lines that matter
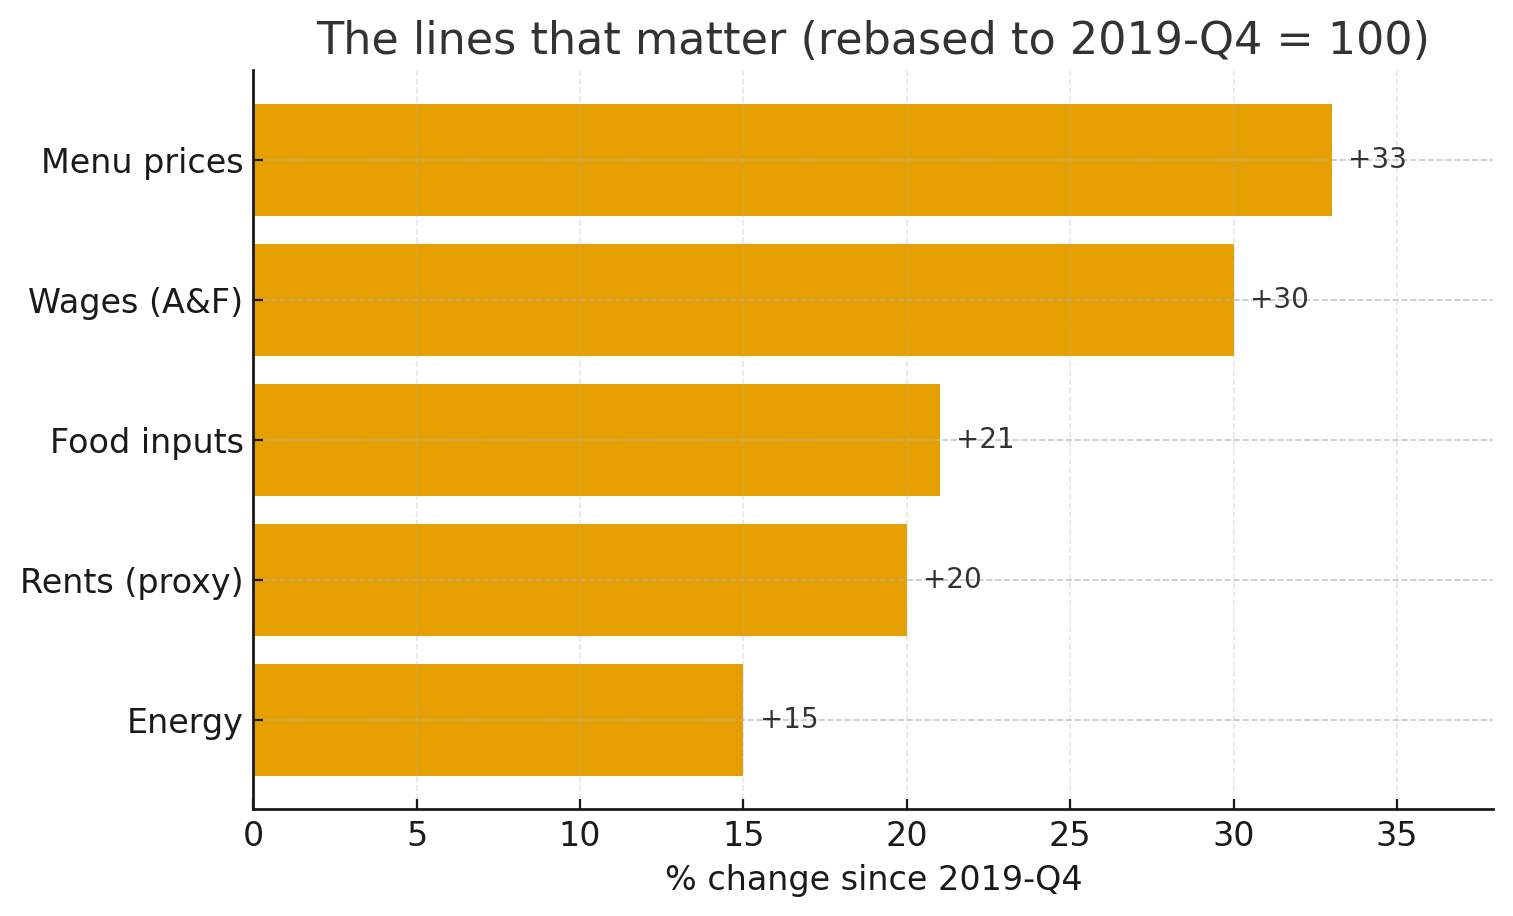
Cumulative % change since 2019-Q4: Menu +33, Wages +30, Food +21, Energy +15, Rents +20.
The “margin gap,” decoded
Think of the margin gap as: Menu-price index minus a relevant cost index.
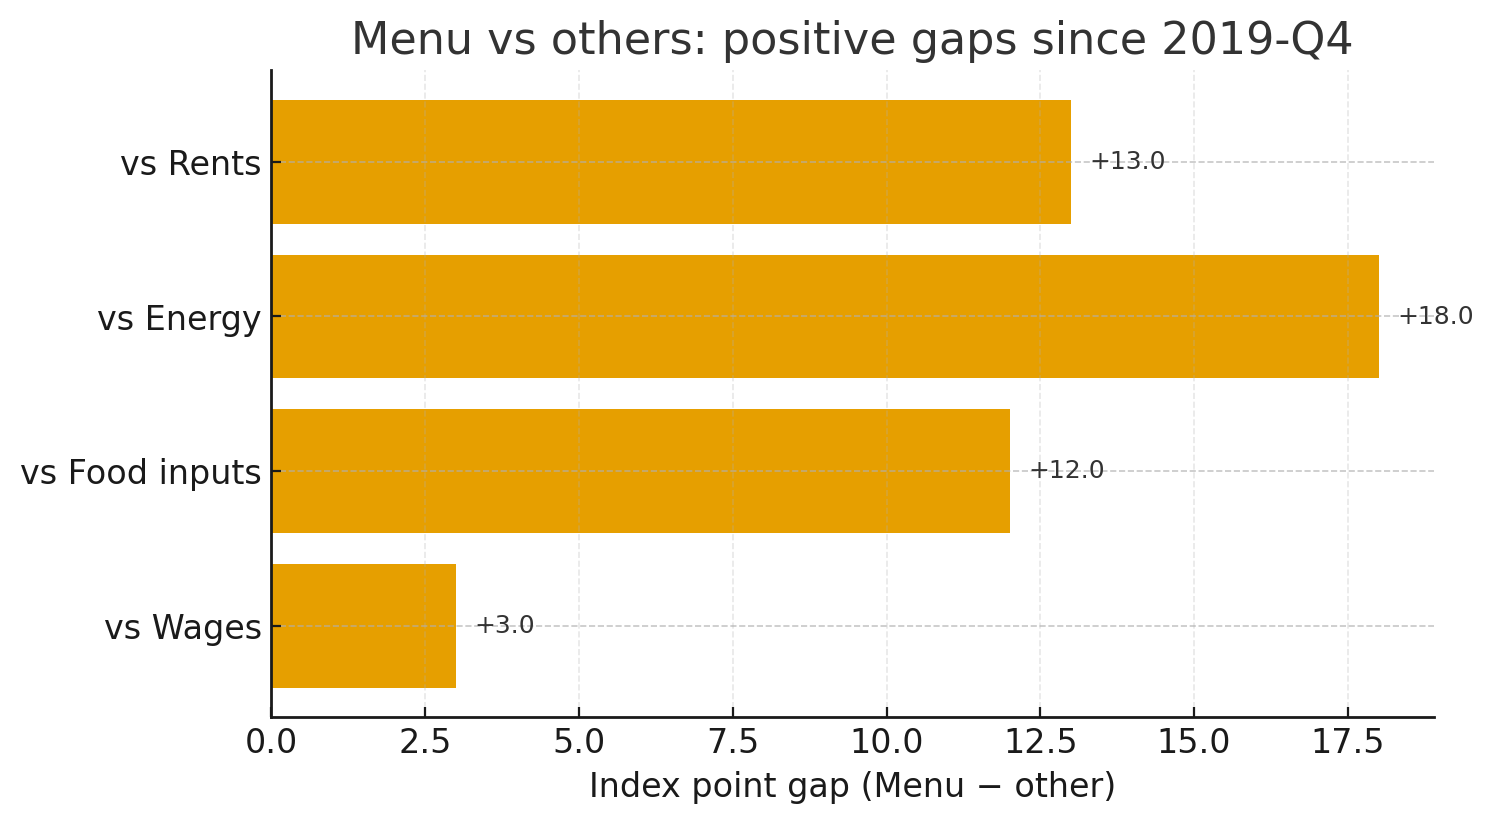
Against wages: Menu (~133) – Wages (~130) ⇒ ≈ +3 pts.
On average, operators passed most wage inflation through. The acute 2022–23 pain has eased into a manageable delta (Stats NZ CPI; QES via Figure.NZ).Against non-labour inputs: Compare Menu (~133) to a simple basket of Food (~121), Energy (~115), Rent (~120). Using a reasonable weight set (Food 0.5 / Energy 0.2 / Rent 0.3) gives a combined index near ~121.
Gap: ≈ +12 pts in favour of price (Stats NZ PPI; CPI rents).
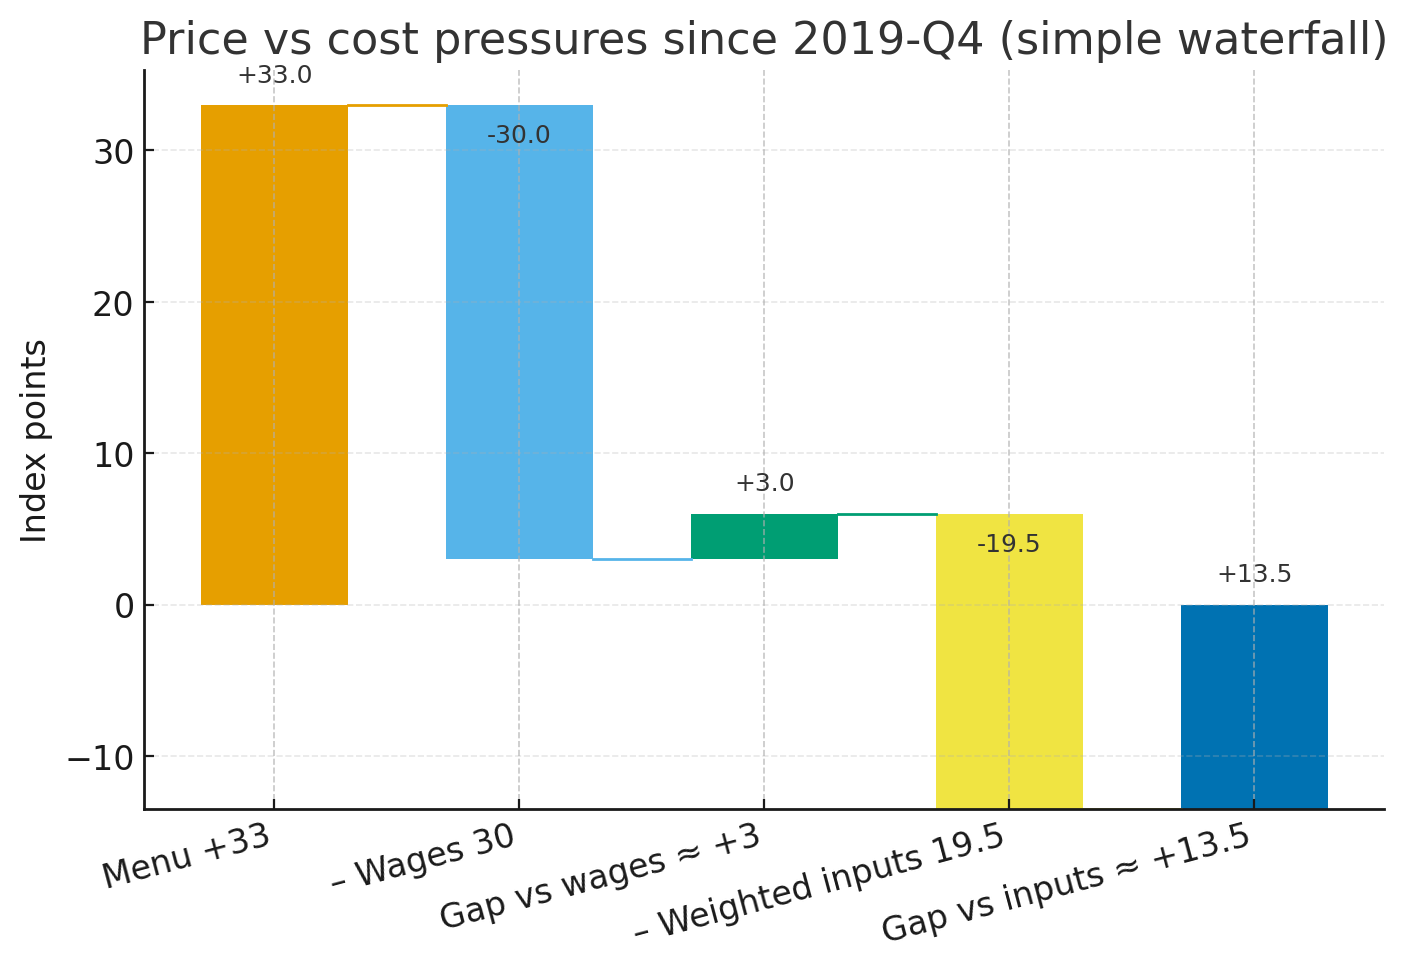
Sensitivity check:
60/20/20 (Food/Energy/Rent) → gap ≈ +11–13
40/30/30 → gap ≈ +10–12
Across plausible mixes, menu prices outpaced non-labour costs.
If the average says “okay,” why does it still feel tight?
Here’s my take:
Format drag: Full-service concepts carry a higher labour ratio. A +30% wage lift hits harder when you promise table touchpoints, cocktails, and complex plating (QES via Figure.NZ).
Lease math: CPI-linked clauses and opex adjustments climb even when trade dips; the CPI rents proxy suggests a steady ~+20% drift since 2019 (Stats NZ CPI).
Volatility scars: The 2022 ingredient shock and energy whipsaws hurt cash flow and inventory discipline, even if the end-to-end index now looks kinder (Stats NZ PPI).
Demand shape: If your revenue is a Fri/Sat mountain with weekday valleys, you still pay for the staff you need on the peaks—and carry them through the troughs.
What to do Monday (moves that compound)
1) Swap “big bang” pricing for micro-moves
Nudge 1–2% quarterly on high-elasticity categories (coffee sizes, by-the-glass wine, popular sides). Anchor signature mains to protect perceived value.
Use “good-better-best” ladders to keep value seekers inside your menu (e.g., 3 burger tiers; two pour sizes for wine).
(Grounding: Menu prices rose fast in 2022–23, then moderated; micro-moves track reality without sticker shock.) (Stats NZ CPI)
2) Design labour; don’t just cut hours
Cross-train to lift throughput per labour hour (one person can close pastry and run pass for last 45 min).
Close-open protections and 4-day blocks reduce fatigue churn (the silent wage bill).
(Grounding: Wages ≈ +30%—the win is productivity, not cuts.) (Figure.NZ – QES)
3) Engineer GP with inputs that settled
Shift dish mix toward seasonal NZ produce and lower-volatility proteins; let addons/sides carry GP (a $5 addon moving from 60%→75% GP changes the night).
(Grounding: Food inputs up ~21% vs menu ~33%—bank the spread with mix.) (Figure.NZ – PPI)
4) Tame energy with process, not capex
Pre-open/close-down checklists: heat only when the first table is within 30 minutes; strict HVAC set-backs; batch-cook aligned to reso waves.
(Grounding: Energy +~15% net but gnarly volatility—discipline beats gear.) (Stats NZ PPI)
5) Bring CPI paths to your lease chat
If you’re CPI-linked, negotiate caps/collars or longer review cycles—arrive with the CPI chart to anchor expectations.
(Grounding: CPI rents proxy ~+20% since 2019; many commercial terms reference it.) (Stats NZ CPI)
Who’s positioned to win next
Hotels with local F&B gravitas: Shared labour pools and dynamic pricing against airport seats & events—best shot at margin recovery.
Premium casual stalwarts: Need dessert/sides to do the heavy lifting; consider a 90-minute table playbook for second turns.
Cafés & QSR: Keep the micro-pricing cadence; expand “snackable” dayparts to smooth weekday valleys.
CBD high-rent venues: Treat private dining and corporate pre-orders as a lease hedge; price peak times unapologetically.
Method, transparency, and limits
Price proxy: CPI Restaurant meals & ready-to-eat food (national) (Stats NZ CPI).
Wage proxy: Average ordinary-time hourly earnings, ANZSIC H (Accommodation & Food Services) (Figure.NZ – QES from Stats NZ).
Food cost proxy: PPI Inputs (food & beverage services / food manufacturing) (Figure.NZ / Stats NZ PPI).
Energy proxy: PPI Electricity & Gas (Stats NZ PPI).
Rent proxy: CPI Actual rentals for housing when commercial indices aren’t public; limitations noted (Stats NZ CPI).
Rebasing: All series compared conceptually at 2019-Q4 = 100; your supplied figures (e.g., ~+33% menu, ~$29.7/h wages by 2025 Q2) anchor the analysis.
What this does not do:
It doesn’t claim profit margins to the decimal; it shows relative pressure by stacking comparable indices.
It doesn’t capture individual lease quirks (CPI+ clauses, stepped reviews), nor local supply shocks.
FAQ
Isn’t “restaurant meals CPI” imperfect?
Yes—it’s a basket proxy, but it’s the best public measure of what diners actually pay (Stats NZ CPI).
Why use CPI rents for commercial leases?
NZ lacks a public commercial rent index. CPI rents are a directional stand-in; many leases reference CPI, so it’s not a wild proxy—just an imperfect one (Stats NZ CPI).
QES vs LCI for wages?
QES’s earnings reflect dollars per hour—most relevant to P&Ls. LCI tracks wage rates holding quality constant; we cite QES as primary and LCI as a robustness check (Figure.NZ).
The quiet advantage: operators who look forward, not back
The curve is stabilising.
The winners in 2025–26 will price little, price often, train for multi-role throughput, and engineer GP where volatility has cooled. Do those three things and the 2022–23 pain becomes a 2025 margin.
——————————————
About the Author
Joshua Thomas is an experienced hotelier, founder of Hospo HR & Chief Editor to Hospitality Pulse. Immersed in the latest hospitality trends, news and updates, Joshua’s passion stems from his lifelong love obsession with hotels & food. Connect with Joshua on Linkedin.